


Transforming towards the future
PwC Luxembourg Annual Review 2023


Message from our Managing Partner
"It is a privilege for me to write the first introduction to our Annual Review as newly elected Managing Partner of PwC Luxembourg as from 1 July, 2023. I am proud to say that we managed a very smooth transition from the previous to the new leadership and minimised any loss of momentum from a leadership change. Also, as you can read in this Annual Review, we managed to strengthen our Governance in ensuring a robust diversity in our leadership bodies.[...]"
François Mousel
Financials and full-year results
A year of transformation - for tomorrow
Our financial year, which spanned from 1 July 2022 to 30 June 2023, was one characertised by inflation and its impact, leading to uncertainty. Geopolitical tensions, vulnerable supply chains and rising energy prices are three contributing factors. More recently, the annual inflation rate in the Euro Area was revised lower to 5.2% in August 2023 from an initial estimate of 5.3%, marking the lowest reading since January 2022, but it is still a slow and sustained trend that affects consumer confidence and therefore businesses.
No firm can be sustainable and successful in the long term without strong principles of governance, values and internal controls. In this section, we report on the six most important dimensions to us as PwC Luxembourg:
- Governing Purpose,
- Stakeholder Engagement,
- Quality of Governing Bodies, and
- Ethical Behavior
- Anti-corruption
- Risk and opportunity Oversight
"Trust is built through authentic, transparent and credible actions that are aligned with our corporate purpose. Governance is the foundation of how we build that trust and continued long-term value with all our stakeholders."
Our Purpose and Values are the foundation of our success. We are committed to building trust with all of our stakeholders and delivering quality in the marketplace, which translates into sustained outcomes. This is critical in the current environment where competition, societal expectations and the risk of disruption are more present and demanding than ever before. As a hugely diverse business, our purpose and values bind together everything we do. It sums up our role beyond serving our business purpose and how we contribute to society more broadly.
It is not enough for us to just state what our purpose is. We have to make sure not only that our People are aware of it, but also of how it governs our actions and consequently our outcomes and our impact. We measure this by asking our internal stakeholders—our People; through our Global People Survey, year on year on the level of achievement—an extract of which is below.
"Our ambition as PwC Luxembourg locally is to be the most impactful, trusted and dynamic professional services partnership and - in our core markets - beyond the borders of Luxembourg. We strive to be a leader, a standard setter and a role model in what we do and how we organise ourselves. We consider strong financial results as an outcome and not a purpose in itself."
Awareness of our Purpose*
Based on those numbers, we note that more than two thirds of our People are aware of our Purpose and Values; however, we still fall slightly short of our target of 75% and the increase in FY23 was only 1%. As a consequence, we will reinforce the messages around our Purpose and Values in the various Firm communication channels in FY24.
*Calculation based on the Global People Survey results of 12 questions on our PwC Purpose and Values
Firm Level FY23
69%
Firm Level FY22
68%
Trend
Target
>75%
To understand what should matter to us as a Firm in order to sustain our long-term success, we need to understand what is important to our most significant stakeholders.
At PwC Luxembourg, we engage in extensive consultations with all our stakeholders, through surveys and interviews with our clients, our people, our alumni, our network, the investor community, as well as other important stakeholders, like our suppliers or public decision makers or authorities.
In 2016, together with our stakeholders, we identified 15 sustainability topics that are crucial for our Firm to address: seven priority challenges and eight additional challenges.
Since then, our Firm is committed to aligning those sustainability topics with our business model through the application of the WEF IBC.
Our intention is to renew our PwC Luxembourg materiality matrix together with our stakeholders in the FY24 calendar year following the Corporate Sustainability Reporting Directive (CSRD) guidance. This involves a dual materiality approach, where we engage our critical stakeholders, including our clients to determine what services hold material significance for them.
PwC Luxembourg’s sustainability transformation journey since 2016 is summarised in our Sustainability Journey.
Materiality Matrix

Source: Results of PwC LU 2016 Materiality Matrix Assessment
Material topics of PwC Luxembourg
Our FY23 ambitions with regard to the material topics can be summarised in the following table. Please note that in FY23, these ambitions were still mainly qualitative while - for FY24, they will become mainly quantitative (please refer to Sustainability Journey).

As a professional services partnership, it’s our People who make the direct impact on our clients, it’s our People who execute on our strategy and it’s our People who drive our values. Consequently, the People Engagement Index (PEI) is one of the most critical parameters that we watch at leadership level.
This year, the trend is positive and above our target. As leadership, we were very proud of that result, specifically in a year with very strong growth and resource constraints. In line with our Network guidelines, our aim is to improve the PEI each year by 2% until we reach a percentage above 85%. Our People strategy, deployed under the leadership of Roxane Haas, has that as an objective, with a particular focus on proximity management.
Firm Level FY23
79%
Firm Level FY22
75%
Trend
Target
>81% (FY24)
>85% (long term)
*Consolidated figure based on the following questions:
- I enjoy working at PwC
- My personal values align with the values demonstrated at PwC
- I would recommend PwC as a great place to work
- I am proud to work at PwC
- I feel like I belong at PwC
No data for FY20 as no GPS has been performed due to Covid19 pandemic.
We cover 80% of the WEF IBC KPIs this year and also include the Expanded Metrics that are relevant to us. For the WEF IBC Core Metrics that we did not cover, we are currently investigating to which extent and under what format they are relevant for our business.
*Availability of the WEF IBC KPIs, including related GRIs, in our Annual report
Expanded core metrics disclosed when relevant, with no commitment to reach 100%
WEF IBC Core Metrics*
Firm Level FY23
80%
Firm Level FY22
69%
Trend
Target
100% unless clear absence of relevance
WEF IBC Expanded Metrics*
Firm Level FY23
83%
Firm Level FY22
N/A
Our Firm is ultimately managed by the Country Leadership Team (CLT). Each member of the CLT is a “gérant” of PwC Société Coopérative and, as such, has specific rights to engage our Firm. Our Territory Senior Partner (TSP) is elected every four years by the partnership in accordance with a pre-defined election process proposed by our Supervisory Board and adopted by the partnership. Similarly, each CLT member is proposed by the TSP and then confirmed individually by a majority vote of the partnership.
Our governance structure as from 1 July, 2023 can be summarised in the following organisation chart.
Additionally, our Firm has an Internal Audit function reporting directly to the CLT.
Further information on the composition and responsibilities of each of these bodies is provided in our Transparency Report - section 6.

FY23 Sustainability governance and our operating model - key actions:
After the election of our new TSP and CLT, a new governance and operating model was put in place in April 2023. The current Country Leadership Team is now fully in charge of the sustainability strategy in order to “Walk the Talk” and demonstrate the appropriate “Tone-at-the-Top”:
- Our Chief Sustainability Officer (CSO) is Francois Mousel, Territory Managing Partner. The Deputy leading the Operations is Christophe Pittie
- There are also four pillar leaders, from top management following the WEF IBC:
- Principles of Governance - Francois Mousel, TSP
- Planet - Anne-Sophie Preud’homme, Chief Financial Officer and Chief Administration Officer
- People - Roxane Haas, People Leader
- Prosperity - Cécile Liégeois, Clients & Markets Leader
A Corporate Sustainability Office has been structured to put into action the Firm’s Sustainability Strategy. This should be a catalyst to drive and monitor the operations and the cultural change through PwC Luxembourg needed to be successful in our own sustainability transformational journey.
To execute our sustainability action plan, each leadership function wrote a Charter embedding Sustainability principles. This means that non-financial key performance indicators (KPIs) are now considered in the definition of the priorities of each of these functions.
Measuring our progress
Measuring our progress helps to keep us on track. This requires monitoring what we do against milestones and targets. Specifically:
- Our Corporate Sustainability Office is in charge of the monitoring and reporting on our non-financial KPIs supporting the 12 Ambitions they are engaged on, with a report provided to the CLT at a regular basis, and
- Our Committees take the ownership on the KPIs and related targets through our Accountability Framework.
FY24 will be dedicated to reinforce the monitoring process on Sustainability KPIs and the quality of the underlying data used to measure our progress and ensure our engagement towards our ambitions.
We are currently not at our objective of a 40%/60% corridor with an insufficient percentage of female members to our main leadership teams. As the leadership team members are mainly partners, we are logically close to (in fact slightly better than) the overall gender repartition of the partners, which is 72% male and 28% female.
We have set our target for FY27, since we normally review fundamentally our leadership teams after each TSP election, i.e. every four years.
One of our main structural challenges is an insufficient pipeline in female talent. The current People Pillar strategy aims to improve our figures in a long-term perspective. This will be a consequence of our overall gender diversity ambition.
It is important to note that gender is one parameter considered during the nomination process. The other ones are disclosed in the “Diversity in Bodies composition” section.
Firm Level FY23
Female - 31%
Male - 69%
Target
40% / 60% (both ways) in FY27
*Based on the average composition of all the leadership teams supporting our key functions (cf. Quality of governing bodies)
Target 40/60% in both ways for FY27 after next TSP election
It is undisputed that diverse leadership teams lead to better decision making by incorporating a broader range of views, experiences and backgrounds.
Having our leadership teams’ compositions more aligned with our diversity (all criteria considered) is a necessity to more broadly represent our population and make decisions based on the entire richness of viewpoints and cultures.
The "diversity" criteria we monitor for the moment are:
- Gender
- Age
- Seniority in the Firm
- Industry and Lines of Service (LoS)
- Nationality
We acknowledge that there might be additional dimensions to the “diversity” notion, but we wanted to start with this first set of pragmatic dimensions, which we believe are the most impactful.
*Calculated on a pool of a total of 84 committee members in 18 committees in FY23
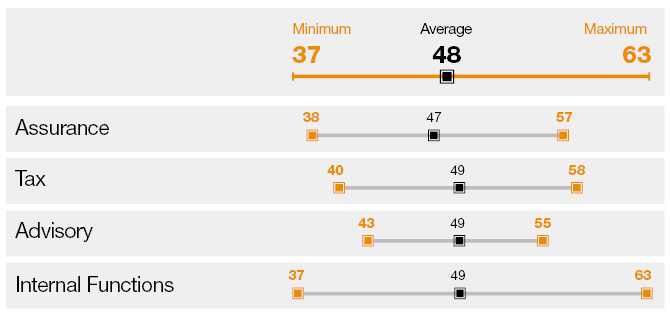
Age
We note that currently, the average age of our leadership team members is 48 years. Based on the fact that our partners currently need to exit the partnership at the latest at 60 years, our ambition is to reduce that average by 2 years to 46 years.
One measure is to strengthen and accelerate the career development of our directors to be ready for partnership earlier as well as expose our young partners to opportunities in leadership teams sooner based on a closer and more proactive management of their early partner career.
Age in years
Seniority in the firm (in years)

Seniority in the firm
We can note a different result depending on the LoS considered. The smaller seniority for the Advisory LoS is explained by a larger number of direct entries among the Advisory partnership, i.e. partners joining is from outside. We want to keep overall a high seniority level for the members of our leadership teams as a high seniority is reflective of the strong “PwC culture” that we want to foster.
Lines of Services and Industries representation*
The overall ambition is to have a leadership team composition broadly aligned with our total population weights. In practice, we note a slight under-representation of the Assurance, compared to Advisory and Tax. Industry representation is aligned with our ambition to be representative of our firm population.
*Calculated on a pool of more than 3000 employees and 84 committee members in FY23
Nationality
The results of the nationality make-up of various committees show a representation of the Firm's population demographic.
The higher representation of Belgian nationals in our governing bodies is due to the fact that typically it takes about 10-15 years to access a leadership committee position and the historical overweight of Belgian nationals in the earlier years of our Firm. Since then, our staff population has greatly diversified, as have the nationalities of the candidates considered for leadership positions. This overweight should therefore be resolved over time.
*Total population represents more than 3000 people.
Trust is built based on a culture of transparency, respect and Speak Up culture . That’s why we encourage an ethical culture inside our Firm that empowers our people to “do the right thing” without fear of reproach. Our Governing Purpose is supported by the strong foundation of our PwC Code of Conduct, our Values, and the continuous fostering of an ethical environment.
As a professional services firm much of our success depends on our ability to build and sustain trust, inside our Firm and outside. This is consistent with our main purpose to build trust in society and solve important problems.
The motto of our ethical culture can be summarised as: Speak up. Listen up. Follow up.
Our values define who we are and how we behave. They set the expectations we have for the way we interact with each other, our clients, and in the communities in which we operate. These values, and the behaviours that they require from us, are relevant to all of us. Having a Speak Up culture encourages and empowers everyone to demonstrate each of our five values, and to call out when something is not aligned to our values, to help build an inclusive workplace.
Our internal Ethics and Business Conduct Committee (EBCC) is composed of an independent chair, the Ethics and Business Conduct Leader and a college of Partners as well as an Ethics Officer. The committee oversees our values and ethical behaviour and is devoted to creating an open culture where everyone feels respected, included and valued while being able to bring their whole self to work.
Our Ethics and Compliance policies and practices ensure that we embed ethical behaviour into our human resources, the way we conduct our business, and the way we engage with our clients and our suppliers.
Beyond the Ethics Helpline, a whistleblowing platform, they also provide our workforce with other supporting channels such as a team of confidential counselors, the Ethics Counselors. The members of the EBCC and the confidential counselors are selected with diverse backgrounds and considering their proximity to our People.
Our Code of Conduct is based on the PwC Purpose and a core set of shared values. The Code sets out a common framework around how we are expected to behave, do business and to do the right thing. The Code is a living document to respond with agility to the ever changing environment in which we operate. The very last version has just been released.
We require the same high standard of ethical behaviour from third parties and their personnel that we require from our own people. Our Third Parties are also requested to apply our Third Party PwC Code of Conduct.
Upholding these detailed policies and procedures is the foundation of ethical behaviours. Measuring our progress also helps to keep us on track.
The following data offer some key insights into how we are doing, and how we are perceived to be doing regarding our ethical behaviour.
The Ethical Behaviour Index aims to help our Firm understand how Ethics is perceived Firm-wide, tracking trends and then making a comparison with trends in our global network.
The KPI is calculated based on the average answers to three questions on Ethics matters which are annually asked in the Global People Survey:
- At PwC, I can speak openly, including voicing my opinions or raising any concerns, even when my views may be different from others. (FY23 - 67%)
- At PwC, I feel comfortable discussing or reporting ethical issues and concerns without fear of negative consequences. (FY23 - 65%)
- The people I work with demonstrate conduct consistent with PwC's Global Code of Conduct. (FY23 - 83%)
After a relevant increase between FY19 and FY21, our Ethical Behaviour Index stabilised around 72% over the last two years, demonstrating the positive impact of our efforts in this area.
Firm Level FY23
72%
Firm Level FY22
72%
Trend
Target
>75%
*Average of three questions related to ethics on the GPS (Global People Survey), calculated on a basis of 2,609 answers in FY23.
No data for FY20 as no GPS has been performed due to Covid19 pandemic.
In order to reach our targets, our action plan is built around two pillars:
- Governance and strategy, and
- Awareness and preventive actions.
Ethics is about all of us, collectively and individually. Governance and strategy implies a close collaboration within the PwC leaders and with the Human Capital team. Our Territory Senior Partner is personally involved via our sustainability initiatives supervising directly the Ethics dimension.
Our awareness and preventive actions are also reviewed on a regular basis, among other things to take into account developments in the Luxembourg market. In our programme we have considered in particular the inclusion of moral harassment in the labour code and the legislation on whistleblowers.
After several months of virtual communication due to the COVID pandemic, we are also returning to in-person forums and a strong presence on the ground thanks to our Ethics Counselors.
The ethical culture perception KPI aims to help PwC understand if the Speak Up culture is in place. To the question: “At PwC, I can speak openly, including voicing my opinions or raising any concerns, even when my views may be different from others.”, we obtained 67% of positive answers, which is in the path to reach our target. By improving our Ethical Behavior index following its action plan described above, we will also increase our Ethical culture perception.
*Calculated on a basis of 2,609 answers to the GPS (Global People Survey) in FY23.
Want to know more?
Firm Level FY23
67%
Firm Level FY22
66%
Trend
Target
>70%
Ethical training modules are mandatory to all our PwC partners and employees on an annual basis. The content of our training is reviewed in an ad-hoc manner to consider trends, our new needs and take into account what our people tell us. This training helps us to foster ethical behavior, the PwC values and the Code of Conduct. It helps all of us to build trust in how we do business, with each other and in our communities.
*Mandatory training, offered every year to our entire population. Our new joiners are requested to do this during the onboarding process, including Short Terms and Trainees.
Firm Level FY23
100%
Firm Level FY22
100%
Trend
Target
100%
As auditors of financial statements and providers of other types of professional services, PwC member firms and their partners and staff are expected to comply with the fundamental principles of objectivity, integrity and professional behaviour. In relation to assurance clients, independence underpins these requirements. Compliance with these principles is fundamental to serving the capital markets and our clients.
More insight on our anti-corruption practices in our Transparency report.
Anti-corruption training
Our Firm has established guidance, procedures and controls to minimise the corruption risk. PwC employees receive regular communication reminding them the rules and the appropriate behaviour to be displayed in any circumstance. A mandatory training is organised at the time of on-boarding, as well as once a year, to ensure an active learning. This mandatory training is part of our Annual Ethics & Compliance Curriculum and participates to our quality management process (QMP). It helps our employees to understand what corruption means and what forms it can take. It explains the risk indicators, what to screen for or how to determine the risk. It contains a specific focus on the work for the public sector and high risk countries. This training is crucial to convey the tone at the top of zero tolerance for corruption and to make each and every employee a protecting barrier against corruption.
*Done through the compliance mandatory training, requested every year to all our population. Our new joiners are requested to do it during the onboarding process, including Short Terms and Trainees.
Firm Level FY23
100%
Firm Level FY22
100%
Trend
Target
100%
Our Quality Management for Service Excellence (QMSE) framework requires the Firm to conduct annually a review of the effectiveness of the Firm’s internal process. This covers all material processes such as financial, operational, compliance, and risk management.
In FY23, we reviewed the principal risks facing the Firm, including those that would threaten the Firm’s business model, future performance, solvency or liquidity, and included consideration of the sustainability of the audit practice.
The key risks faced by our business and the management response are summarised in the FY23 Risk Register.

The long term preservation of the planet is a common responsibility between Government, private businesses and citizens. At PwC, we consider the following dimensions to be areas of focus:
- Net Zero,
- Land use and ecological sensitivity,
- Water consumption, and
- TCFD.
"It is evident that, compared to other economic sectors, our ecological footprint as a professional services firm remains limited on a comparative basis. Yet, it’s our responsibility to still do our part of the common effort and lead by example."
Since we began measuring emissions in 2007, we have significantly reduced our total carbon footprint. A new baseline was set by the PwC Network in FY19, and our ambition to halve our Carbon Footprint until FY30, is measured against that. Our Scope 1 & 2 emissions have already decreased by 24%. This means that the vast majority of our remaining emissions are from Scope 3 sources, the most significant of which relate to business travel related to client work and client related events.
Our Scope 3 emissions increased between FY21 and FY22 as a result of the increase in travel following the pandemic. However, our Scope 3 emissions for FY22 remain well below the 2019 total. We will continue to work to reduce our emissions as part of our aim to halve our operational footprint by 2030 compared to the 2019 baseline..
In FY20, PwC reached a significant milestone by making a worldwide commitment to achieve net zero greenhouse gas (GHG) emissions with near-term science-based targets for FY30. In July 2021, our near-term emissions reduction targets were independently validated by the Science Based Targets initiative (SBTi). Our targets are in line with a 1.5-degree scenario to prevent the worst impacts of climate change, as set out in the Paris Agreement.
As a result of disruption due to COVID-19, we have seen a substantial reduction in CO2 emissions between FY19 and FY20. The pandemic has accelerated the shift to remote working and demonstrated the feasibility of new delivery models of our services, as part of a longer-term transformation. Since FY19 which is our baseline, we have succeeded in decreasing our emissions by 53%. This is a good start, but we need to keep that CO2 consumption level up to FY30, while we expect a significant increase in our activity until then. This is quite a challenge. We are committed to applying a travel policy which balances the need for travel in a small, very open and international economy and the aim to contribute to the overall decarbonisation effort.
Scope 1, 2 and scope 3 Business Travel emissions (tco2e)
FY23
2,949
FY22
2,391
FY19
6,240
Trend
Target
-50% by FY30 vs FY19
During this year, we have pursued other targeted actions that resulted in operational emission reduction:
- Decreased heating temperature in winter and cooling temperature during summer,
- Reduction of ventilation period by one hour,
- Reduction of the number of lights on by one third in our parking lots,
- Collaboration with our catering provider to reduce their electrical consumption (they consume about 15% of the electricity consumed in the building) and influencing their habits and processes (e.g. not to turn every equipment on automatically in the morning),
- Reduction of our fleet of photocopiers by 2 thirds, with smarter management of the power consumption.
Scope 1 emissions (tco2e)
FY23
178
FY22
304
FY19
312
Trend
Scope 2 emissions (tco2e)
FY23
365
FY22
447
FY19
400
Trend
Target
-50% by FY30 vs FY19
Business travel is an essential part of how we operate and service our clients. It is also our largest source of (controlled) emissions. Our objective is to reduce by 50% our business travel emissions by FY30 compared to our FY19 emissions, which are our baseline.
The COVID-19 pandemic led to a significant reduction in travel emissions over the last three financial years and showed the potential of delivering our services in a more virtual mode. As travel restrictions eased and we resumed our international travels, our emissions inevitably increased. Despite this increase in FY23, we have managed to reduce our emissions by 56% compared to FY19.
In order to proactively manage the Scope 3 emissions target, we have implemented targeted measures at curbing our emissions resulting from business travel and to proactively decouple travel from the growth of our business, maintaining the momentum created by our changing habits during the COVID period. Our target is to limit our carbon emissions to half of our FY19 emissions while our business continues to grow. To achieve this goal we will:
- Travel smarter: if/when travel is necessary, we will optimise the transportation mode, incl. Air travel class, and
- Travel less: we will engage with our clients from the outset of an assignment regarding the trip planification to reduce the number of journeys, identify the key moments of a mission lifecycle to decide between remote or face-to-face meetings, use local or regional resources, review the international training and events planning, encourage hybrid types of meetings for larger groups with some physically present and others via videoconference.
Scope 3 emissions (tco2e)
FY23
2,406
FY22
1,640
FY19
5,528
Trend
Target
-50% by FY30 vs FY19
We will also take advantage of ‘passive gains’ from airlines as they also decarbonise (e.g. selecting and booking flights using SAF - Sustainable Aviation Fuel) and offset the remaining emissions that we cannot otherwise eliminate.
Although our Scope 3 emissions reduction target is currently limited to our focus on business travel emissions, going forward, we are planning on widening this to take into account our emissions from staff commuting and procurement of IT.
Commuting
In addition to our actions to reduce our business travel emissions, we are implementing measures to reduce emissions from employee commuting, such as the development of our network of satellite offices located near the borders. We will continue to expand them as we are growing very quickly and are aiming to double the number of seats available in the next couple of years, as well as find innovative solutions to enable this expansion in a sustainable way.
We continue to develop our mobility strategy to take account of the significant increase in traffic forecast in the National Mobility Plan 2035. To achieve this, we are focusing on car-pooling and car-sharing, on the development of soft mobility and, above all, public transport, with the arrival of the tram at the Cloche d'Or in 2024.
All these changes will only be possible by increasing the awareness of our People to the opportunity they have to be part of the movement which has started. This will materialise in active information campaigns and education programs. As a company, we aim at being an enabler to climate change beyond the activities of our Firm and encouraging people to further contribute as world citizens.
We started calculating the proportion of CO2 emissions of our suppliers with credible GHG emissions targets, with the aim to reach 50% coverage by FY25, following PwC Network commitment.
By encouraging our suppliers to decarbonise their operations and products, we will create a “ripple effect” in the market. This is where we can have a significant impact in accelerating the global transition to the net zero economy.
% of suppliers with GHG reduction targets (by emissions)
FY23
41%
FY22
N/A New measure
Target
50% by FY25
FY23 Scope 3 supply chain emissions
22,406 (tco2e)
Of our eight offices, 98% of our purchased electricity comes from renewable sources. Our main office, Crystal Park, has been 100% powered by renewable electricity since 2011.
% of electricity sourced from renewables
FY23
98%
FY22
98%
Trend
Target
100% by FY30
We recognise the importance of actively reducing the climate impact of our own operational footprint now. That is why, to mitigate our impact today, we will continue to support high-quality independently verified carbon reduction and removal projects.
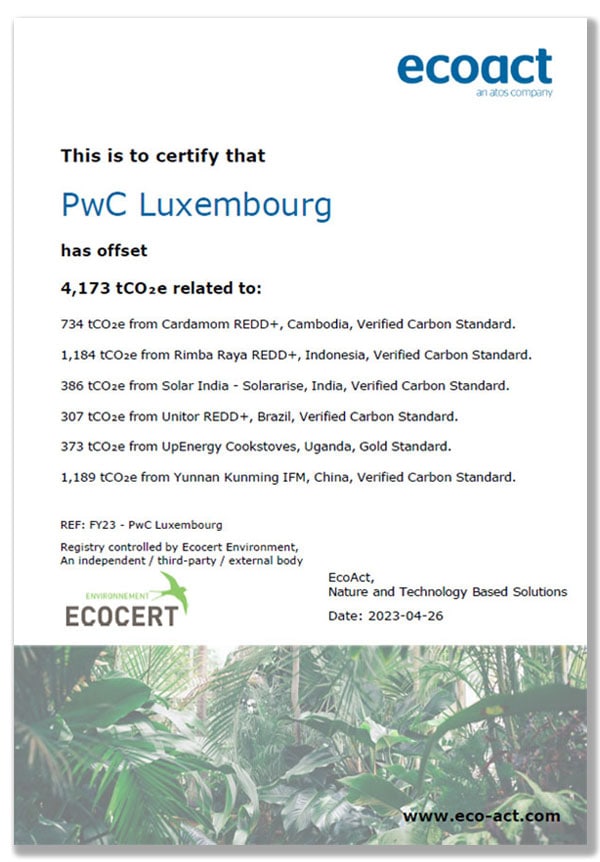
Since 2022, we have been purchasing these credits through a centralised carbon credit procurement service provided by the PwC Network. We offsetted:
- 2,370 tonnes CO2 in FY22 with Natural Capital Partners, and
- 4,173 tonnes CO2 in FY23 with EcoAct (the increase compared to FY22 is explained by the post covid period).
This year, we offset more than our direct carbon emissions as we have been able to limit our emissions beyond our initial forecasts.
However, we want to emphasise that we are more focussed on reducing emissions than in offsetting.
Our future ambition includes collaborating with local and regional carbon-offsetting projects as well as transitioning our carbon offset portfolio to 100% carbon removals by FY30.
As from FY24 onwards, we have committed to offset 100% of our direct emissions through our participation in the LEAF coalition (Lowering Emissions through Accelerating Forest finance).
Carbon credits (tCO2e)
FY23
4,173
FY22
2,370
Target
Transition to 100% carbon removals by FY30
This year, for the first time, we are releasing data on our land use and ecological impact, fully aligning with the recommendations of the WEF IBC. As an office-based business our land use is minimal.
Among our eight current offices and our future main campus, three offices (Wemperhardt, Dudelange and Biwer Wecker) are adjacent to protected areas and/or Key Biodiversity Area respecting national rules.
Given the office-based nature of our operations, we do not have a large direct water footprint.
Although our water consumption increased by 20% since FY19 (18,253m3), 0% of it is sourced from regions with high baseline water stress. In fact, in Crystal Park (our main building), 60% of the water comes from Luxembourg’s own springs in Muhlenbach, Septfontaines, Pulvermühl, Grunewald, Kopstal and Birelergrund, while the remaining 40% is sourced from surface water from the Upper-Sûre Lake.
What happened in the course of last year?
We worked with our main supplier in the building who reduced their water consumption. We stopped the automatic watering of the park property. Despite those efforts, the massive return to the office of our employees has resulted in the increase of our water consumption.
As one of the members of the Task Force, the PwC Network played an active role in the development of the TCFD framework and recommendations, and we are a signatory to the TCFD recommendations at a global level.
The framework helps business leaders to spot, assess and deal with the risks and opportunities from climate change with the aim of accelerating the overall transition to the Net Zero future. Since 2021, PwC Luxembourg has incorporated some of the main TCFD into the 12 Priority Ambitions.
Furthermore, PwC Luxembourg made a commitment to adopt the Corporate Sustainability Reporting Directive (CSRD) which integrates the principal principles of TCFD for its FY25 reporting. By taking this step one year in advance of the requirement applying to large private companies in the EU, we are demonstrating a steadfast commitment to sustainability within our firm.
At PwC Luxembourg, our common vision is to be the most impactful, dynamic and trusted partnership for our clients and all our stakeholders, in Luxembourg and beyond its borders. The key to realising this vision is people.
That’s why we are constantly improving our HR strategy with the aim to be a leading organisation for inclusion and belonging for our People, our clients and external stakeholders, as well as a leading employee destination for diverse talent. Our actions focus on improving our People's wellbeing, providing relevant training to employees to enable prosperous outcomes, strengthening our diversity and inclusion efforts and maintaining pay equality.
Monitoring our progress helps keep us on track. Therefore, our diversity data plays an important role in helping to shape the steps we take to achieve our ambitions.
"Our ambitions cannot be realised without our People, meaning we must strive to offer those who already work for us, and those we wish to attract in an increasingly difficult talent market, an environment where they can grow and develop, where they feel safe to be themselves, where they have a healthy work life balance, and where they strongly feel their purpose."
At PwC Luxembourg, we believe that empowering and promoting gender, age, disability and ethnic/cultural diversity are important and are closely correlated to both financial and non-financial performance. A diverse workforce allows for a rich career path and broadens perspectives at Firm level if and when employees feel included and respected. This is why we monitor how our Firm could be even more diverse than we are today, starting with gender, but also—increasingly—how we can monitor our diversity within a much wider definition.
We’ve set targets for ourselves in relation to gender and publicly report on our progress against them - as displayed below.
You can find further information on our Diversity and Inclusion actions and progress on our dedicated page.
You can also find our pay gap data in the Pay Equality section of this hub.
Our ambition is to improve our gender diversity at each grade and lines of services to achieve a 40% - 60% gender balance no matter whether this is 40% women and 60% men or the opposite.
At Firm-level, our gender ratios are broadly comparable to last year with 44.6% women and 55.4% men.
Higher grades see a clear gap with 30% women at Director level and 27% at Partner level. From Associate to Senior Manager grade, the ratios reflect the Firm’s target (40%-60%). This represents in absolute numbers 80% of our People. Our Administrative roles are still attracting many more females. We observe a slightly negative trend at Associate level as women represented 45.6% in FY23 vs 50.1% last year, it shows the challenges to attract female graduates.
We are looking at gender diversity —and diversity more broadly— in all aspects of the employee lifecycle like recruitment, promotion and retention, but also in the composition of our governance bodies. To act on ensuring that the trend in our gender diversity is improving, we have launched and continued a number of actions such as:
Female
Firm Level FY23
44.6%
Firm Level FY22
45.8%
Trend
Male
Firm Level FY23
55.4%
Firm Level FY22
54.2%
Trend
Not Declared**
Firm Level FY23
<0.1%
Firm Level FY22
<0.1%
Target
40% - 60% in both ways
*Only people from PricewaterhouseCoopers Société coopérative, PricewaterhouseCoopers Academy Société à responsabilité limitée and PwC Tax Information Reporting Société à responsabilité limitée. Interns, Contingent Workers and Short Term Assignments have been excluded from the calculation.
**We point out the very small number of the “Not declared” which relates to people who do not recognise themselves in the current proposed gender categories or who do not wish to declare their gender.
Figures as of 30 June 2023
Our Inclusion & Diversity Index reflects how satisfied our People are with our efforts to build a diverse and inclusive work environment. It has improved over the last years at Firm-level to 74% in FY23.
We added in our Learning & Development curriculum a training named Inclusive Mindset Badge to raise awareness.
As from FY24, Inclusion & Diversity are part of the topics included in our onboarding programmes for new joiners and newly promoted employees, as well as part of our awareness programme for Team Leaders. We aim to expand further the way we envision diversity. Topics on our diversity agenda will include from FY24, disability—which we are working on with our Global network—, as well as age/generational gap and ethnicity/cultural diversity for the years to come.
Please have a look at our Diversity and Inclusion website
Firm Level FY23
74%
Firm Level FY22
72%
Trend
Target FY25
80%
***Derived from the GPS results on these following statements in FY23:
1) The people I work with make the effort to get to know me and what I uniquely bring to PwC.
2) The leaders I work with actively build a diverse and inclusive work environment.
3) I am satisfied with the actions Territory Leadership has taken to build a diverse and inclusive work environment.
4) I feel like I belong at PwC.
We believe that providing equal remuneration for the same jobs, irrespective of gender or ethnicity/cultural diversity is crucial to attract talent and drive long-term competitiveness. We aim to offer rich professional opportunities for all of our People depending on their skills, motivation and aspirations. This is why we are monitoring our remuneration in terms of gender equity, a commitment we began several years ago.
Gender pay gap of employees (excluding partners)*
As in previous years, we use Logib, the Minister of Equality between Men and Women’s standard analysis tool, enabling employers to conduct their own equal-pay analysis. Our last external reporting from Logib dated September 2022 and led to a conclusion on a gender pay gap below -1%.
Our figures show a similar gender pay gap compared to last year: i.e. a gender pay gap below 1% in favor of men. To put these results in perspective, the November 2022 edition of Eurostat report shows that in 2020, women’s gross hourly earnings were on average -13% below those of men in the EU. The smallest gender pay gap was measured in Luxembourg (-0.7%), which is comparable to our own ratio.
Beyond the gender pay gap, we are looking at how women and men have equal chances to access management roles and promotions through our proportional promotion approach explained in our “Proportion of employees per gender” KPI.
Firm Level FY23
< -1%
Firm Level FY22
< -1%
Trend
Target
< -1%
*Based on gross salary data
We are primarily reliant on our People to deliver our services to clients. This is why we aim to provide our employees the opportunity to enhance their wellbeing and their mental health, for their own prosperity and towards a sustainable future for our Firm. At PwC Luxembourg, we believe that working proactively in the areas of health and wellbeing will help identify and mitigate potential risks.
Our Flexibility & Wellbeing Index demonstrates the level of how satisfied our People are with finding a balance between work and personal life that works for them and working with people who make wellbeing a priority. Answers to the questions of our Wellbeing and Flexibility Index are the following:
Question |
FY21 |
FY22 |
FY23 |
1. I am able to find a balance between work and my personal life that works for me |
49% |
52% |
53% |
2. The people I work for make wellbeing a priority for our team(s) |
45% |
55% |
58% |
3. It is possible to have a healthy lifestyle (physically, mentally, emotionally) and be successful at PwC |
44% |
48% |
50% |
The trend is positive. Although we are happy to see improvements in this area, we cannot be satisfied with these results. We will continue to spend the necessary time to listen to our People on that topic and take the appropriate actions.
Looking at the results across the grades, the Flexibility & Wellbeing Index is 51% or below from Senior Associate level to Director with a low-end of 44% at Manager level. We are aware of our employees’ difficulties and challenges at these grades. This could be partially attributed to the formidable business growth and the lag in time needed to recruit the adequate resources we needed leading to a very intense workload.
Our strategy is structured around 4 areas:
Firm Level FY23
54%
Firm Level FY22
52%**
Trend
Target
60%
*Our latest Flexibility & Wellbeing Index results from answers to these following questions:
1. I am able to find a balance between work and my personal life that works for me
2. The people I work for make wellbeing a priority for our team(s)
3. It is possible to have a healthy lifestyle (physically, mentally, emotionally) and be successful at PwC
**FY22 Index has been restated to the FY23 methodology.
As part of our Health & Safety related ambition, it is important to ensure we are able to identify people with mental and physical difficulties caused by stress, anxiety and significant workload. We are looking at several indicators in that field, including the absenteeism rate for illness-related absences, which provides a view over how much our People are absent due to sickness while comparing with the local sector benchmark.
| Assurance | Advisory | Tax | Internal Functions | |
| FY 23 | 2.0% | 1.8% | 2.5% | 2.5% |
| FY 22 | 2.4% | 2.5% | 3.3% | 2.6% |
As per the latest available report of the Observatoire de l’absentéisme, the indicators for our Firm are generally below the sector average. We note that overall 2022 statistics were exceptionally high largely due to COVID.
FY23 figures are below FY22. Although this is a good sign, it does not mean that we cannot explore ways to help people manage their work and private life.
This encourages us in carrying on our efforts on wellbeing and mental health as well.
Firm Level FY23
2.1%
Firm Level FY22
2.9%
Trend
***Only people from PricewaterhouseCoopers Société coopérative, PricewaterhouseCoopers Academy Société à responsabilité limitée and PwC Tax Information Reporting Société à responsabilité limitée.
Interns, Contingent Workers and Short Term Assignments have been excluded from the calculation.
The calculation follows the proposed methodology of the Liser Report, where the total sickness days are divided with the total workable days (including weekends and public holidays)
Our aim is to hire and develop the best and most diverse teams, creating a culture where the best people want to stay and build their careers.
We believe that investing in, and upskilling, our People will enhance their satisfaction, as well as our Firm’s performance. As the skills our People need to support our clients and ensure sustainable solutions continue to shift, so does our training. We offer a wealth of continuously updated and relevant learning opportunities, enabling our People to be the inclusive, quality-driven, and expert leaders our clients require. Beyond monitoring the number of training hours we provide, we ensure that our People are given the right technical and behavioural learning experiences at the right time.
Average number of hours of training per employee
Learning & Development is paramount to our Firm and to build a sustainable future for PwC Luxembourg, as well as a meaningful and enriching journey for our People.
We have always offered a rich training opportunity in not just technical skills but soft skills as well. In FY23, we went even further and developed a catalogue of 50 soft skills training modules with a clear focus on leadership & team management skills, such as coaching and communication. Other topics covered by our Learning & Development offering include business development, technical training, digital upskilling, wellbeing/mental health, and values and Inclusion & Diversity, specifically through our Inclusive Mindset training.
Within our Talent Programme, our Soft Skills training catalog was created as a development framework that should help all our employees have a long-term view on their professional growth and career development.
Assurance is logically the primary LoS (Line of Service) using Learning & Development due to mandatory training and external certifications.
Our People’s satisfaction toward our Learning & Development improved from 59% in FY22 to 66% this year. In addition, our Global People Survey (GPS) results point out that 74% of our People consider that the leaders they work for support them in making time to participate in learning and development opportunities aligned with their career interests and development needs.
Going forward, in FY24:
- We are introducing mandatory training on ESG basics to promote awareness on sustainability and on I&D.
- Upskilling people to promote internal mobility and broaden their career path is also a focus of our L&D practice.
- Introduce new learning technologies based on AI.
- Revamp our digital upskilling programme.
- Develop external certifications to upskill our People on the Core skills of the future (ESG, Valuation experts).
Firm Level FY23
54.3 hours
Firm Level FY22
53.4 hours*
Trend
Target
n/a
*We report on the average number of training hours per headcount (employees excluding trainees, contingent workers, and short term assignments). As we have changed the way we calculate this indicator, the figure we reported in our annual review last year, 58H, was slightly above the one we report this year. This is because this year, we set our indicator based on the training completion date, as opposed to the starting date.
The economic wellbeing of our People is directly linked to the fair compensation and benefits they receive. This is why we report on how the entry salary in our Firm is compared to the local minimum salary.
Salary Level Ratios of standard entry level salary by gender compared to local minimum salary*
The average entry level salary we offer at PwC Luxembourg is above the local minimum salary. The salary level ratios increased significantly this year. We made this decision to the benefit of our People to help them gain access to the real estate market, whether this is for rent or to acquire their home. In addition, we also have significantly raised our employees salaries in selected client-facing positions.
Aside from this rebalancing, we have also made an extra investment to significantly increase the salaries in the groups where reinforcing our compensation position on the market was the most needed.
*Standard entry level salary: Full time reference salary for our new hires who have joined at junior level (excluding experienced new hires) during the financial year.
Target population: Associate 1 for business LOS
Administrative & Associates in Internal Functions & Secretary where age at hire date is between 18y and 25y
Ratio of entry level salary to local minimum: for each hire in the above defined target population we have calculated: FT reference salary / Luxembourg Qualified Minimum Social Salary applicable at hire date.
Female
Firm Level FY23
1.20
Firm Level FY22
1.09
Trend
Male
Firm Level FY23
1.23
Firm Level FY22
1.11
Trend
PwC asks all of our suppliers to sign our Charter of Responsible Purchases. By signing this Charter, our suppliers have agreed to respect the Universal Declaration of Human Rights (UDHR) and follow social, ethical and environmental requirements.
We have set a goal for ourselves to become the most impactful, dynamic and trusted professional services partnership in Luxembourg and beyond its borders. And we recognise that true prosperity has to be sustainable, underpinned by a diverse services and work environment that puts our People at the heart of everything we do.
To ensure we will be successful in this, we will:
- Build a meaningful journey for our clients and people;
- Bring direct monetary and non-monetary value to our stakeholders and the community around us;
- Generate market leading growth by innovating and extending our service scope;
- Invest to support the Firm's ambition to help organisations build trust and deliver sustained outcomes. For this we will work on the digitisation and ESG transformation of our services as well as the transformation of our delivery models using sourcing and AI;
- Engage with our local stakeholders and our network constantly; and
- Support our communities through indirect economic impacts.
"Prosperity is at the heart of how we are able to align value creation for our stakeholders and for us. This is about our ability to maintain and grow our business while having a positive social and environmental impact."
Employment and wealth generation are intrinsically linked. Our People are at the heart of our 12 priority ambitions on sustainability. This is why we aim to attract, develop, reward and retain the best talent from a diverse range of backgrounds by building a meaningful journey for them and creating a culture where our people want to stay and build a career.
With more than 3,200 people as of 30 June, 2023, we had 400 more employees than last year on the same date. This 14% increase in our headcount illustrates our attractiveness and capacity to provide career opportunities. In addition, our low employee turnover can be seen as an indication of employee satisfaction, although we believe that a minimum turnover of 10% is a healthy rate for ensuring we remain innovative and diverse.
In FY22, we had reported on both our total and voluntary turnover. Our total turnover in FY22 and in FY23 includes a significant number of Short-Term Assignments i.e. secondees from other PwC offices, who were accounted for in our employees statistics. This significantly distorts our total employee turnover figures leading to a gap with our voluntary turnover indicator which does not give the correct picture. This is why, this year, we report on our voluntary turnover only.
We are happy to observe that our voluntary turnover decreased from a peak at 18.0% in FY22 to 12.3% this year, which is even below FY21 level (14.5%).
| Assurance | Advisory | Tax | Internal Functions | Secretaries | |
| FY23 | 15.3% | 14.0% | 10.5% | 6.0% | 9.3% |
| FY22 | 22.9% | 19.4% | 16.0% | 10.6% | 8.5% |
We see a clear improvement at all grades with a strong shift at Associate level with 11.3% turnover in FY23 compared to above 20% last year. This shows that our retention tools are on the right track.
To achieve these positive results, we developed and deployed a strategy where:
- We promote flexibility, as a retention tool;
- We revised our compensation model;
- We propose multiple initiatives to enhance our People's wellbeing;
- We leverage on Inclusion & Diversity; and
- We offer very rich and diverse Learning & Development opportunities.
Having a remuneration level consistent with market practice is of course important for our recruitment candidates and employees, but work-life balance, wellbeing, flexibility and Learning & Development are increasingly high on people’s requirements and this is confirmed by the exit interviews we do when people leave. A person with purpose who feels safe and valued and who has room to develop and learn is significantly more likely to stay with us. For FY24, we will continue to invest in those dimensions to recruit and retain talents. We provide more information about these topics in the People section.
FY23
12.3%
FY22
18.0%
Trend
Target
10%-15% range
*Voluntary turnover = Number of voluntary terminations /Average headcount.
Voluntary terminations = resignations and end of probation period initiated by the employee.
Average headcount = Sum Headcount each month divided by number of month as from beginning of a Financial Year.
At PwC Luxembourg, we believe that job creation provides a basic indication of our capacity to attract diverse talents. This is why we are looking at how many new recruits we have during the year through a gender lens.
| Firm level FY22 | Firm level FY23 |
Total: 700 |
Total: 893 |
Overall, we have hired 28% more people than last year partly to replace leavers, as we experienced a high employee turnover in FY22, but also to improve our workforce capacity. This was specifically the case for Assurance and Tax for which we recruited respectively 35% and 60% more than in FY22. We focused this year on attracting more Associates and more Managers compared to last year.
We have recruited 15.8% more women than last year. However, the proportion of men among the new hires is significantly above women. We act where we can have an impact to make things evolve in a more gender-diverse workforce such as being present earlier in students' lives. We bring gender-diverse PwC representatives to universities and schools to explain what we do in our day-to-day jobs and how we manage our work-life balance. But, on a short- to medium term- basis, the female talent shortage in schools and universities make it difficult to reverse the trend for gender diversity in our hiring process.
On top of this, attracting talents in Luxembourg remains challenging, partly due to the combination of mobility issues and a tight and expensive real estate market.
For FY24, we will continue to nurture our pipeline of talents with a strengthened investment in several initiatives such as Women & Men, Shine and Back & Happy which are further detailed in the People section. We will also continue to ensure that the gender diversity lens is fully embedded in our recruitment strategy.
Female
Firm Level FY23
39.4%
Firm Level FY22
43.4%
Trend
Male
Firm Level FY23
60.5%
Firm Level FY22
56.4%
Trend
Not Declared
Firm Level FY23
0.1%
Firm Level FY22
0.1%
Target
40% - 60% in both ways
***Only people from PricewaterhouseCoopers Société coopérative, PricewaterhouseCoopers Academy Société à responsabilité limitée and PwC Tax Information Reporting Société à responsabilité limitée.
Interns, Contingent Workers and Short Term Assignments have been excluded from the calculation.
For the calculation, the starting date of the new hires has been taken into consideration.
At PwC Luxembourg, we believe that economic contribution provides an indication of how a company is able to create prosperity for stakeholders, including our People, our Clients and our Communities at large.
We report on our Firm turnover and net revenues as these indicators provide a valuable snapshot of the direct monetary value added to the markets in which we operate through the delivery of our services.
We are pleased to report a +16.8% increase in our net revenue (based on turnover), taking us to year ended 30 June, 2022.
As a professional services firm in Luxembourg, we believe this was an exceptional year despite the disruption. We were—and continue to be—able to adjust our services to respond to our clients’ needs. We also continue to invest for tomorrow's needs, for example, on our Environmental, Social, and Governance (ESG) services offer.
Further information on our financials can be found in our comprehensive Business Review including Revenue by LoS (Line of Service).
Discover more
Turnover
€634.7m
Net Revenue
€563.4m
Growth
+16.8%
We define community investment as all activities, alongside financial contributions, pro bono services and volunteering that we are pursuing with the sole purpose of delivering social, environmental and economic benefits to our local communities.
As one of the main employers in the country, we want to create long-term value through our core business while having a positive social, environmental and economic impact. We are convinced that we have a role to play in this field and we are also happy to see that our highly skilled workforce is eager to contribute their time and talents to causes that matter to them.
We want to support communities via active contribution, like providing financial support to projects, delivering pro bono services as well as giving time to help non-profit organisations. In FY23, we have regrouped our actions (financial support and volunteering) into five topics that summarise in what we have been mostly active and supported to in the past years:
- Integration - access to education
- Culture - participation to culture
- Health - including wellbeing
- Climate - carbon emission reduction
- Humanitarian aid - emergency relief
In FY23 we have focused our help and efforts to contribute to the utmost urgent and serious causes. We have listened to our People's concerns and therefore we have been very much active to support populations affected by the earthquakes in Turkey and Syria. Our community of employees coming from these countries were largely involved in helping affected communities and organising local support.
Our target we would like to set ourselves for next year would be to financially support projects and causes within these key topics for an amount of €500k, which would mean more than doubling the amount we have given in FY23.
In FY24, we will continue our efforts by leveraging on our enhanced governance on Community Engagement and our reinforced workforce in our Corporate Sustainability Office and beyond. We are analysing how to further increase our impact by increasing the envelope dedicated to community investment as well as further focusing our efforts.
We will promote volunteering by giving dedicated time to our People: employees can now take the opportunity to dedicate 40 hours to Community Engagement per year for volunteering during work hours, primarily on our supported initiatives but also on self-sourced initiatives in line with our priority topics.
We are developing additional partnerships with non-profit organisations requiring support for their activities, being educational, social or environmental and will be proposing more volunteering initiatives to our People.
Please check our dedicated section on our community engagement, that we update regularly with our initiatives.
Cash donations*
FY23
€236k
FY22
€143k
Trend
Target FY24
€500k
*Cash donations reflect the gross monetary amounts paid by the Firm in support of a community organisation or Project
Business community engagement
Outside community engagement, we believe that we have an important role to play locally to support the vitality of the business communities in which we operate. We are committed to many professional and industry associations to which we actively contribute by sharing expertise, primarily from our management teams, through working groups but also as members of the board of these organisations. Looking forward, we want to carry on growing our engagement towards our local business communities by contributing time to industry and professional organisations.
Starting FY24, we are monitoring our contributions more closely to enhance our efforts where we think it has a positive impact for our local business community.
In line with our global ambition to help organisations build trust and deliver sustained outcomes, as well as our own mission to be the most impactful, dynamic and trusted professional services partnership in Luxembourg and beyond - we have to be absolutely relevant, and that takes investment. This is how we are transforming towards the future:
- By, investing in our existing services transformation as well as in the development/innovation of new services;
- Investing in sustainability, for our clients and for ourselves;
- Investing in R&D allocated to projects related to ESG topics, Managed Services, and our Alternatives and AWM industries, with a focus on forging Alliances, primarily in the Tech sector.
PwC is a professional services firm with a long-standing and profound focus on core competencies in audit and assurance, tax advisory and compliance, business advisory and managed services. We invest in a unique set of methodologies, business know-how, quality standards and tools to support our clients in the achievement of sustained outcomes and trusted business models.
Our investment strategy
The local business environment and markets of our clients are constantly subject to change and transformation. We as a Firm fully endorse such change and have since many years conducted a multi-layer innovation and transformation strategy. This strategy is based on the innovation and technology provided by the PwC Network and global member firms as well as based on local innovation and transformation initiatives.
We invest significantly in our existing services transformation as well as in the development/innovation of new services. These investments are not only focusing on technology and data management, but also on business process improvements, organisational changes, upskilling of our people and client specific solutions.
We have continued our transformation journey by further enhancing our current digital solutions and building new ones. Our strategy is structured around five priorities:
- Lines of Services Transformation to constantly adapt ourselves to our client needs,
- Managed services as a focus to support our clients operations,
- Delivery models new approaches to more agile work models,
- Sustainability services and Corporate Sustainability to be confident for our long-term future as well as to support our clients sustainability agenda,
- IT & Data transformation to enhance our capabilities, support transformation and allow for an efficient ICT and data management.
We are also excited to work with our Network in the development (representing a $1.3b investment globally) of a new audit ecosystem for our next generation audit.
In FY24, our target is to keep the same investment pace, close to 4% of our Turnover, and focus on sustainability services and managed services to answer client needs in these two very active areas.
Our long term investment target is to stay above 4% of our Turnover.
FY23
4.7%**
€29.6m
FY22
4.6%**
€25m
Trend
Target FY24
4.2%***
€29.2m
Long term Target
>4%***
*% = Investment / Turnover
Figures include expenses and internal people time dedicated to investment projects.
**Past years figures are realised investments.
***Following years are the budget investment projects.
R&D is a dedicated budget for FY23. See below.
For our clients, a significant investment was made in the current year to develop our Sustainable Finance Disclosure Regulation (SFDR) Assurance Digital Solution that will underpin our ESG assurance engagements for SFDR Level 2 Disclosures. Our ESG assurance approach combines the latest technology with a robust methodology delivered by professionals with in-depth expertise in ESG and sustainable finance. Our advisory teams have also invested in new approaches and methodologies to answer efficiently our clients' concerns on ESG.
For ourselves, the Sustain@PwC programme was a heavy investment to reinforce our strategy towards sustainability, resulting of a strong Accountability Framework on Sustainability endorsed by our Country Leadership Team, and a better coordination through our Corporate Sustainability Office. Our efforts on Net Zero are also a relevant and efficient investment for our decarbonized future.
We will continue to invest in Sustainability for the following years and keep 20% of our total investment for this purpose.
FY23
16%
€4.8m
FY22
12%
€3m
Trend
Target FY24
18%
€5.4m
Long term Target
20%
*% = investment in sustainability / total investment
Our research and development (R&D) operates with a team of experts dedicated to identifying market trends and generating new and innovative ideas for our Firm. We foster innovation through regular events and initiatives, encouraging our staff to propose new solutions for our clients. With the support of our team of experts, these solutions are incubated, and the collaboration between this team and our internal and business services transforms these solutions into tangible services and products to meet our clients' needs.
Aligned with our investment and transformation strategy, the FY23 expenses for our R&D are allocated to support projects related to ESG topics, Managed Services, and our Alternatives and AWM industries. A significant focus is placed on forging Alliances with both local and international players, primarily in the Tech sector.
Looking ahead to FY24, our initiatives will revolve around four key investment areas: Managed Services, Sustainability Services, Delivery Models, and support to Lines of Services Transformation. We plan to enhance collaboration between our R&D team and our Technology and Transformation team, strengthening our commitment to innovation and excellence.
FY23
€1.64m
FY22
N/A*
Target FY24
€2.4m
Figures include expenses and internal people time dedicated to R&D team and projects.
Past years figures are realised investments as the following years are the dedicated budget to R&D team and projects.
*In FY22, R&D activities were considered as part of the total investment budget presented above, and not as a dedicated bucket.
The information on this page is correct as of October 2023.
PwC Luxembourg Annual Review 2023


Follow us


