


Appendices
WEF IBC disclosures
In 2021 we conducted a materiality assessment of the 21-core metrics introduced by the World Economic Forum (WEF) and the International Business Council (IBC), “Towards Common Metrics and Consistent Reporting of Sustainable Value Creation”. We identified which ones are a priority for us currently and selected 12 metrics where we can have the most impact for our stakeholders and in the ecosystem we operate. Since then, we have set targets and ambitions, as well as a system of monitoring and reporting through FY23, allowing us to fully align with the metrics that are material to us.
We disclose in this table all the core metrics as well as provide disclosures illustrating the adoption status we reached. More details are available in our FY23 Annual Review.
Principles of Governance
Theme |
Metric and Disclosure |
Adoption status |
Additional details |
Governing Purpose |
Setting Purpose The company’s stated purpose, as the expression of the means by which a business proposes solutions to economic, environmental and social issues. Corporate purpose should create value for all stakeholders, including shareholders.
|
Full |
PwC Purpose and Values: Our purpose is to build trust in society and solve important problems. Our values define who we are, what we stand for and how we behave. Corporate Sustainability is embedded in our business model and supports our long-term success. We dedicate time for our prioritised 12 Ambitions to make an impact so that we, as a firm, can be confident for our long-term future. |
Quality of governing body |
Governance body composition Composition of the highest governance body and its committees by: competencies relating to economic, environmental and social topics; executive or non- executive; independence; tenure on the governance body; number of each individual’s other significant positions and commitments, and the nature of the commitments; gender; membership of under- represented social groups; stakeholder representation. |
Partial |
We committed to combine diversity in our governance structure to enhance inclusion and equity, as well as reflecting all different nationalities, seniorities, ages, background expertise and genders. Our governance structure as from 1 July 2023 can be summarised in the following organisational chart:
Our Chief Sustainability Officer (CSO) is the Territory Managing Partner. There are also four pillar leaders, from top management following the WEF IBC:
Missing disclosures for a full coverage:
|
Stakeholder engagement |
Material issues impacting stakeholders A list of the topics that are material to key stakeholders and the company, how the topics were identified and how the stakeholders were engaged.
|
Full |
In 2016, together with our stakeholders, we identified 15 sustainability topics that are crucial for our Firm to address: seven priority challenges and eight additional challenges. Since then, our Firm is committed to aligning those sustainability topics with our business model through the application of the WEF IBC. Our FY23 ambitions referring to the material topics is 12 ambitions on the 21 composing the WEF-IBC. Our intention is to renew our PwC Luxembourg materiality matrix together with our stakeholders in the FY24 calendar year, following the Corporate Sustainability Reporting Directive (CSRD) guidance. This involves a dual materiality approach, where we engage our critical stakeholders, including our clients, to determine what services hold material significance for them. |
Ethical Behaviour |
Anti-corruption 1. Total percentage of governance body members, employees and business partners who have received training on the organisation’s anti-corruption policies and procedures, broken down by region. a) Total number and nature of incidents of corruption confirmed during the current year but related to previous years; and b) Total number and nature of incidents of corruption confirmed during the current year, related to this year. 2. Discussion of initiatives and stakeholder engagement to improve the broader operating environment and culture, in order to combat corruption. |
Partial |
Anti-corruption: As auditors of financial statements and providers of other types of professional services, PwC member firms and their partners and staff are expected to comply with the fundamental principles of objectivity, integrity and professional behaviour. In relation to assurance clients, independence underpins these requirements. Compliance with these principles is fundamental to serving the capital markets and our clients. Our Firm has established guidance, procedures, and controls to minimise the corruption risk. A mandatory training is organised at the time of on-boarding, as well as once year, to ensure an active learning. This mandatory training is part of our Annual Ethics & Compliance Curriculum. It explains the risk indicators, what to screen for or how to determine the risk. It contains a specific focus on the work for the public sector and high-risk countries. This training is crucial to convey the tone at the top of zero tolerance for corruption and to make every employee a protecting barrier against corruption. Missing disclosures for a full coverage:
|
Ethical Behaviour |
Protected ethics advice and reporting mechanisms A description of internal and external mechanisms for: 1. Seeking advice about ethical and lawful behaviour and organisational integrity; and 2. Reporting concerns about unethical or unlawful behaviour and lack of organisational integrity.
|
Full |
Trust is built based on a culture of transparency, respect, and Speak Up culture This is why we encourage an ethical culture inside our Firm that empowers our people to “do the right thing” without fear of reproach. Our Governing Purpose is supported by the solid foundation of our PwC Code of Conduct, our Values, and the continuous fostering of an ethical environment. The motto of our ethical culture can be summarised as: Speak Up. Listen up. Follow up. Our Ethics and Compliance policies and practices ensure that we embed ethical behaviour into our human resources, the way we conduct our business, and the way we engage with our clients and our suppliers. Beyond the Ethics Helpline, a whistleblowing platform, they also provide our workforce with other supporting channels such as a team of confidential counsellors, the Ethics Counsellors. The members of the Ethics and Business Conduct Committee (EBCC) and the confidential counsellors are selected with diverse backgrounds and in consideration of their proximity to our People. Ethical training modules are mandatory to all our PwC partners and employees on an annual basis. The content of our training is reviewed through an ad-hoc manner to consider trends, our new needs and what our people tell us. |
Risk and opportunity oversight |
Integrating risk and opportunity into business process Company risk factors and opportunity disclosures that clearly identify the principal material risks and opportunities facing the company specifically (as opposed to generic sector risks), the company appetite in respect of these risks, how these risks and opportunities have moved over time and the response to those changes. These opportunities and risks should integrate material economic, environmental and social issues, including climate change and data stewardship. |
Full |
Our Quality Management for Service Excellence (QMSE) framework requires the Firm to conduct annually a review of the effectiveness of the Firm’s internal process. This covers all material processes such as financial, operational, compliance, and risk management. Since FY23, we publish our Risk Register externally. This enables our stakeholders to have a look at how we deal with them. |
Planet
Theme |
Metric and Disclosure |
Adoption status |
Additional details |
Climate Change |
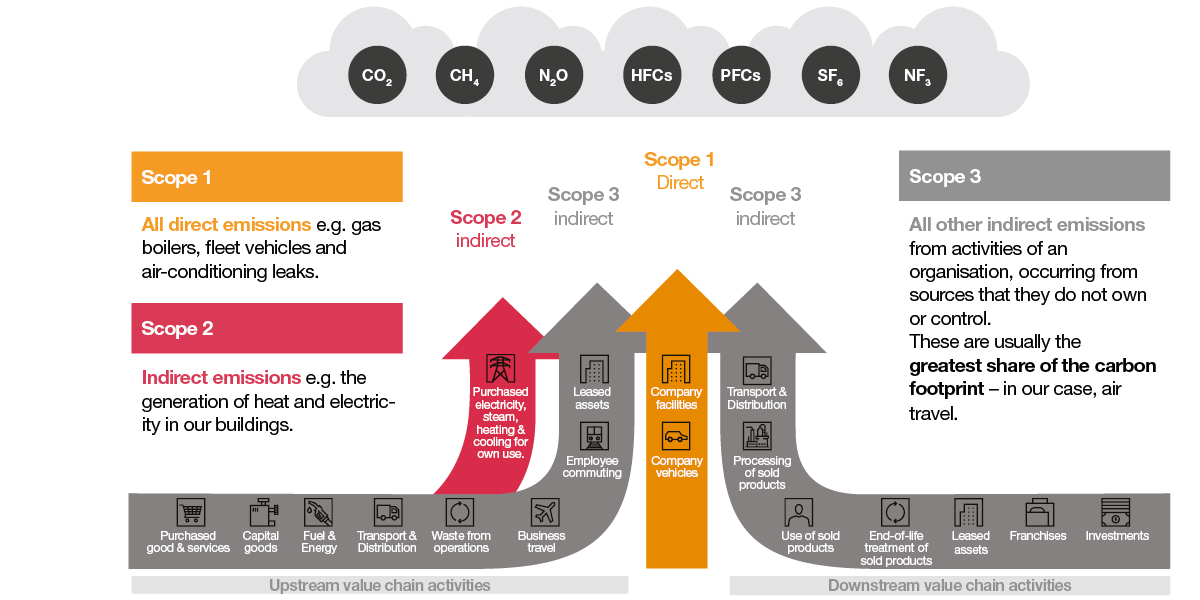
Greenhouse gas (GHG) emissions For all relevant greenhouse gases (e.g., carbon dioxide, methane, nitrous oxide, F-gases etc.), report in metric tonnes of carbon dioxide equivalent (tCO2e) GHG Protocol Scope 1 and Scope 2 emissions. Estimate and report material upstream and downstream (GHG Protocol Scope 3) emissions where appropriate.
|
Full |
In FY20, PwC made a worldwide commitment to achieve net zero greenhouse gas (GHG) emissions with near-term science-based targets for FY30. In July 2021, our near-term emissions reduction targets were independently validated by the Science Based Targets initiative (SBTi). Our targets are in line with a 1.5-degree scenario to prevent the worst impacts of climate change, as set out in the Paris Agreement. Since FY23, we report on Scope 1 & 2 Emissions, Business travel Emissions (scope 3), our % of suppliers with GHG reduction targets (by emissions) and Scope 3 supply chain emissions, covering all requirements of the WEF IBC GHG emission core metric. On top of thiswe also provide insight on our strategy to reach 100% of purchased electricity coming from renewable sources. We continue to offset our emissions. To mitigate, we will continue to support high-quality independently verified carbon reduction and removal projects. However, we want to emphasise that we are more focussed on reducing emissions than in offsetting. |
Climate Change |
TCFD implementation Fully implement the recommendations of the Task Force on Climate-related Financial Disclosures (TCFD). If necessary, disclose a timeline of at most three years for full implementation.Disclose whether you have set, or have committed to set GHG emissions targets that are in line with the goals of the Paris Agreement – to limit global warming to well below 2°C above pre industrial levels and pursue efforts to limit warming to 1.5°C – and to achieve net-zero emissions before 2050.
|
Partial |
As one of the members of the Task Force, the PwC Network played an active role in the development of the TCFD framework and recommendations, and we are a signatory to the TCFD recommendations at a global level. Since 2021, PwC Luxembourg has incorporated some of the main TCFD into the 12 Priority Ambitions. Furthermore, PwC Luxembourg made a commitment to adopt the Corporate Sustainability Reporting Directive (CSRD) which integrates the principal principles of TCFD for its FY25 reporting. By taking this step one year in advance of the requirement applying to large private companies in the EU, we are demonstrating a steadfast commitment to sustainability within our firm. Missing disclosures for a full coverage:
|
Nature Loss |
Land use and ecological sensitivity Report the number and area (in hectares) of sites owned, leased or managed in or adjacent to protected areas and/or key biodiversity areas (KBA). |
Full |
Since FY23, we are releasing data on our land use and ecological impact, fully aligning with the recommendations of the WEF IBC. As an office-based business our land use is minimal. Among our eight current offices and our future main campus, three offices (Wemperhardt, Dudelange and Biwer Wecker) are adjacent to protected areas and/or Key Biodiversity Area respecting national rules. |
Freshwater Availability |
Water consumption and withdrawal in water-stressed areas Report for operations where material: megalitres of water withdrawn, megalitres of water consumed and the percentage of each in regions with high or extremely high baseline water stress, according to WRI Aqueduct water risk atlas tool. Estimate and report the same information for the full value chain (upstream and downstream) where appropriate.
|
Full |
Given the office-based nature of our operations, we do not have a large direct water footprint. 0% of our water consumption is sourced from regions with high baseline water stress. In fact, in Crystal Park (our main building), 60% of the water comes from Luxembourg’s own springs in Muhlenbach, Septfontaines, Pulvermühl, Grunewald, Kopstal and Birelergrund, while the remaining 40% is sourced from surface water from the Upper Sûre Lake. |
People
Theme |
Metric and Disclosure |
Adoption status |
Additional details |
Dignity and Equality |
Diversity and inclusion (%) Percentage of employees per employee category, by age group, gender, and other indicators of diversity (e.g., ethnicity). |
Partial |
At PwC Luxembourg, we believe that empowering and promoting gender, age, disability, and ethnic/cultural diversity are important and are closely correlated to both financial and non-financial performance. A diverse workforce allows for a rich career path and broadens perspectives at Firm level, especially when employees feel included and respected. This is why we monitor how our Firm could be even more diverse than it is today, starting with gender, but also—increasingly—how we can monitor our diversity within a much wider definition. Considering our proportion of employees per gender, our ambition is to improve our gender diversity at each grade and lines of services to achieve a 40% - 60% gender balance no matter whether this is 40% women and 60% men or the opposite. We also publish our Inclusion & Diversity Index, reflecting how satisfied our People are with our efforts to build a diverse and inclusive work environment. Missing disclosures for a full coverage:
|
Dignity and Equality |
Pay equality (%) Ratio of the basic salary and remuneration for each employee category by significant locations of operation for priority areas of equality: women to men, minor to major ethnic groups, and other relevant equality areas.
|
Full |
At PwC Luxembourg, we believe that, in line with the WEF IBC principles, providing equal remuneration for the same jobs, irrespective of gender or ethnicity/cultural diversity is crucial to attract talent and drive long-term competitiveness. We want to offer rich professional opportunities for all our People depending on their skills, motivation, and aspirations. This is why we are monitoring our remuneration in terms of gender equity, and this is a commitment we began several years ago. We use Logib, the Minister of Equality between Men and Women’s standard analysis tool, enabling employers to conduct their own equal-pay analysis. Beyond the gender pay gap, we are looking at how women and men have equal chances to access management roles and promotions. |
Dignity and Equality |
Wage level (%) Ratios of standard entry level wage by gender compared to local minimum wage. Ratio of the annual total compensation of the CEO to the median of the annual total compensation of all its employees, except the CEO. |
Partial |
The economic wellbeing of our People is linked to the fair compensation and benefits they receive. This is why we report on how the entry salary in our Firm is compared to the local minimum salary. Missing disclosures for a full coverage:
|
Dignity and Equality |
Risk for incidents of child, forced or compulsory labour An explanation of the operations and suppliers considered to have significant risk for incidents of child labour, forced or compulsory labour. Such risks could emerge in relation to: a) type of operation (such as manufacturing plant) and type of supplier; and b) countries or geographic areas with operations and suppliers considered at risk.
|
Partial |
We ask all our suppliers to sign our Charter of Responsible Purchases. By signing this Charter, our suppliers have agreed to respect the Universal Declaration of Human Rights (UDHR) and follow social, ethical, and environmental requirements. PwC publications: Human Rights Policy and Human Rights Statement. Missing disclosures for a full coverage:
|
Health and wellbeing |
Health and safety (%) The number and rate of fatalities as a result of work-related injury; high-consequence work-related injuries (excluding fatalities); recordable work-related injuries; main types of work-related injury; and the number of hours worked. An explanation of how the organisation facilitates workers’ access to non- occupational medical and healthcare services, and the scope of access provided for employees and workers.
|
Partial |
We are primarily reliant on our People to deliver our services to clients. This is why we aim to provide our employees the opportunity to enhance their wellbeing and their mental health, for their own prosperity and towards a sustainable future for our Firm. At PwC Luxembourg, we believe that working proactively in the areas of health and wellbeing will help identify and mitigate potential risks. We disclose our Flexibility & Wellbeing Index, demonstrating the level of how satisfied our People are with finding a balance between work and personal life that works for them and working with people who make wellbeing a priority. Our actions in this area are structured around 4 areas: Proximity management of our people, Flexibility and working conditions, Health and Safety and Boost our people’s wellbeing. It is also important for us to ensure we can identify people with mental and physical difficulties caused by stress, anxiety, and significant workload. We are looking at the absenteeism rate for illness-related absences compared with the local sector benchmark. Missing disclosures for a full coverage:
|
Skills for the Future
|
Training provided (#, $) Average hours of training per person that the organisation’s employees have undertaken during the reporting period, by gender and employee category (total number of hours of training provided to employees divided by the number of employees). Average training and development expenditure per full time employee (total cost of training provided to employees divided by the number of employees).
|
Partial |
We believe that investing in and upskilling our People will enhance their satisfaction, as well as our Firm’s performance. As the skills our People need to support our clients and ensure sustainable solutions continue to shift, so does our training. We offer a wealth of continuously updated and relevant learning opportunities, enabling our People to be the inclusive, quality-driven, and expert leaders our clients require. Beyond monitoring the number of training hours we provide, we ensure that our People are given the right technical and behavioural learning experiences at the right time. Missing disclosures for a full coverage:
|
Prosperity
Theme |
Metric and Disclosure |
Adoption status |
Additional details |
Employment and wealth generation |
Absolute number and rate of employment 1. Total number and rate of new employee hires during the reporting period, by age group, gender, other indicators of diversity and region. 2. Total number and rate of employee turnover during the reporting period, by age group, gender, other indicators of diversity and region.
|
Partial |
Employment and wealth generation are intrinsically linked. Our People are at the heart of our 12 priority ambitions on sustainability. This is why we aim to attract, develop, reward, and retain the best talent from a diverse range of backgrounds by building a meaningful journey for them and creating a culture where our people want to stay and build a career. We report on our rate of employee voluntary turnover and on our total new hires by gender. Missing disclosures for a full coverage:
|
Employment and wealth generation
|
Economic contribution 1. Direct economic value generated and distributed (EVG&D), on an accrual basis, covering the basic components for the organisation’s global operations, ideally split out by:
2. Financial assistance received from the government: total monetary value of financial assistance received by the organisation from any government during the reporting period.
|
Full |
At PwC Luxembourg, we believe that economic contribution provides an indication of how a company can create prosperity for stakeholders, including our People, our Clients, and our Communities at large. We report on our Firm turnover and net revenues as these indicators provide a valuable snapshot of the direct monetary value added to the markets in which we operate through the delivery of our services. Community Investment: we define community investment as all activities, alongside financial contributions, pro bono services and volunteering that we are pursuing with the sole purpose of delivering social, environmental, and economic benefits to our local communities. We want to support communities via active contribution, like providing financial support to projects, delivering pro bono services as well as giving time to help non-profit organisations. We regroup our actions into five topics:
We also promote volunteering by giving the opportunity to our employees to dedicate 40 hours to Community Engagement per year for volunteering during work hours, primarily on our supported initiatives but also on self-sourced initiatives in line with our priority topics. Missing disclosures for a full coverage:
|
Employment and Wealth Generation |
Financial investment contribution 1. Total capital expenditures (Capex) minus depreciation, supported by narrative to describe the company’s investment strategy. 2. Share buybacks plus dividend payments, supported by narrative to describe the company’s strategy for returns of capital to shareholders.
|
Partial |
We invest a minimum of 4% in our existing services transformation as well as in the development/innovation of new services. These investments not only focus on technology and data management, but also on business process improvements, organisational changes, upskilling of our people and client specific solutions. Our strategy is structured around five priorities:
Missing disclosures for a full coverage:
|
Innovation of better products and services |
Total R&D expenses ($) Total costs related to research and development.
|
Full |
Our research and development (R&D) operates with a team of experts dedicated to identifying market trends and generating new and innovative ideas for our Firm. We foster innovation through regular events and initiatives, encouraging our staff to propose innovative solutions for our clients. With the support of our team of experts, these solutions are incubated, and the collaboration between this team and our internal and business services transforms these solutions into tangible services and products to meet our clients' needs. Total R&D expenses are fully reported, including our innovation strategy, in our Annual Review. |
Community and social vitality |
Total tax paid The total global tax borne by the company, including corporate income taxes, property taxes, non-creditable VAT and other sales taxes, employer-paid payroll taxes, and other taxes that constitute costs to the company, by category of taxes.
|
Not disclosed |
We do not disclose this information. |
Appendix 1 PwC Luxembourg's sustainability transformation journey
| 2016-2020 |
|
| 2020-2021 |
|
| 2021-2022 |
|
| 2022 |
|
| 2023 |
|
Appendix 2 PwC Luxembourg’s Carbon Emissions and Environmental Statistics
1. Net Zero
Our operational boundary
The study of CO2-eq is carried out by listing the emissions according to the different Scopes. It is detailed as follows:
- Scope 1: Natural gas and/or biogas consumption resulting from combustion from Crystal Park; Fuel oil consumption; Petrol consumption by controlled or owned passenger transport in cars (Company cars) fuelled by petrol; Diesel consumption by controlled or owned passenger transport in cars fuelled by diesel; consumption of electric and hybrid cars.
- Scope 2: Total purchased electricity; Purchased heat, steam or hot water for our main office building, Crystal Park.
- Scope 3: Air travel emissions by short, medium and long haul flights, landed-based travel in taxi and train, Flexi cars (salary sacrifice Fleet scheme) accommodations included the room night.
Figure 1: The details of the different Scopes to calculate the emission of CO2.
Calculating Greenhouse Gas (GHG) emissions
PwC Luxembourg follows two methodologies to calculate its GHG emissions. For Scopes 1 and 2, we use the emission factors proposed in the Bilan Carbone, which ADEME (Agence de la Transition Energétique) developed in 2004. We follow the PwC global network methodology based on the GHG Protocol and the Carbon Disclosure Project, using the UK Government Conversion Factors to calculate our GHG emissions from business air travel in Scope 3.
For both methodologies, the following equation was used:
Activity data x Emissions conversion factor (kg CO2e / kWh) = kg CO2 equivalent
- Renewable electricity: We consider renewable: electricity generated from geothermal, solar, sustainably sourced biomass (including biogas), hydropower and wind energy sources. Biomass and hydropower can play a role in decarbonization provided they are created and used sustainably. All our satellite offices are included here.
- Supplier emissions: This emission source only includes the emissions associated with the products and services we buy. This means the upstream emissions, not the entire lifecycle emissions of purchased goods and services. Emissions are calculated based on the type of product or service being procured, the financial value and the location (country) of purchase, and not based on the supplier. Inter-territory costs or services performed by other entities within the PwC network and supply chain beyond our immediate suppliers (i.e. tier n>1 spend by our suppliers on materials or to their vendors) are excluded.
- Emissions offset: Includes the total in tonnes of CO2e abatement per year. This should not include any carbon credits purchased through the Global procurement process as these are accounted for separately by the Global CS team. Our carbon offsets aim to cover scope 1, 2 and business travel emissions.
2. Land use and ecological sensitivity
Includes all our sites owned, leased or managed in or adjacent (i.e. within 1km) to protected areas and/or key biodiversity areas (KBA).
Sources: Zones protégées d'intérêt national - Luxembourg Cadastre - Key Biodiversity Area - Nature and water analysis - IBAT alliance
3. Water consumption
- Megalitres of water consumed for our operations.
- Data currently only available for our main building, Crystal Park.
- Data source: Gestion technique centralisée (GTC)
Appendix 3 Community engagement
Highlights of our financial support this year
Highlights of our people engagement towards communities
Appendix 4 Risk Register
Regulations and/or Public Policy
Risk description |
Risk landscape |
Failure to constructively engage wider stakeholder groups on our commitment to our purpose increases the risk of disruptive regulatory change. Such change could hamper our ability to deliver on our purpose and to operate in a sustainable way. |
Public debate in several countries about the audit profession and multi-disciplinary model that could have long term impact in Luxembourg.
|
Responses |
|
|
|
Regulatory Compliance
Risk description |
Risk landscape |
Failure to comply with relevant independence, legal, regulatory (including sanctions) or professional requirements leading to regulatory action, financial penalties, reputational damage and/or a client conflict of interest. |
|
Responses |
|
|
|
Geopolitical Risk
Risk description |
Risk landscape |
Failure to respond to global geopolitical and economic decoupling that could impact our ability to deliver our strategy. |
|
Responses |
|
|
|
Societal risks and Trust
Risk description |
Risk landscape |
Failure to anticipate, understand and respond to market and societal expectations and concerns, or to engage in the broader societal agenda, will erode trust in our profession and in our business and put the relevance and value of our brand at risk. |
|
Responses |
|
|
|
Technology resilience and availability
Risk description |
Risk landscape |
Failure to manage critical system availability impacting the ability to service clients and manage the business. |
|
Responses |
|
|
|
Evolving new client services and products
Risk description |
Risk landscape |
Failure to stay relevant, to invest and evolve services/products to meet changing market and client needs which could lead to poor business performance and impact the brand. |
|
Responses |
|
|
|
Client and Service Quality
Risk description |
Risk landscape |
A significant failure in client acceptance or service delivery quality in existing and new services with network implications, could impact our reputation and lead to litigation and/or regulatory action. |
|
Responses |
|
|
|
Information and Cybersecurity
Risk description |
Risk landscape |
Failure to manage the security of Firm, Client and our People's data or reduced defences against ransomware attacks could impact our reputation and cause legal and brand damage to the network. |
|
Responses |
|
|
|
Data Strategy and Management
Risk description |
Risk landscape |
Failure to manage and maintain data in compliance with regulatory requirements and the highest ethical standards. |
|
Responses |
|
|
|
People
Risk description |
Risk landscape |
Failure to attract, retain and develop a diverse pool of skilled talent will impact our ability to deploy resources rapidly to realise opportunities, deliver quality, meet clients' changing needs, and deliver our strategy. |
|
Responses |
|
|
|
PwC Luxembourg Annual Review 2023


