


AWM: From 'A brave new world' to a new normal

"AWM: From ‘A brave new world’ to a new normal" takes a past and present look at the asset and wealth management (AWM) industry. In this report, we highlight and contextualise the bold predictions we made in 2014's 'A Brave New World' and 2017's 'Embracing Exponential Change'. Now that the future has arrived, we are holding ourselves to account, assessing these predictions against the current state of the industry and accounting for any alignments or deviations.
Huge rise in assets and shift in the investor base
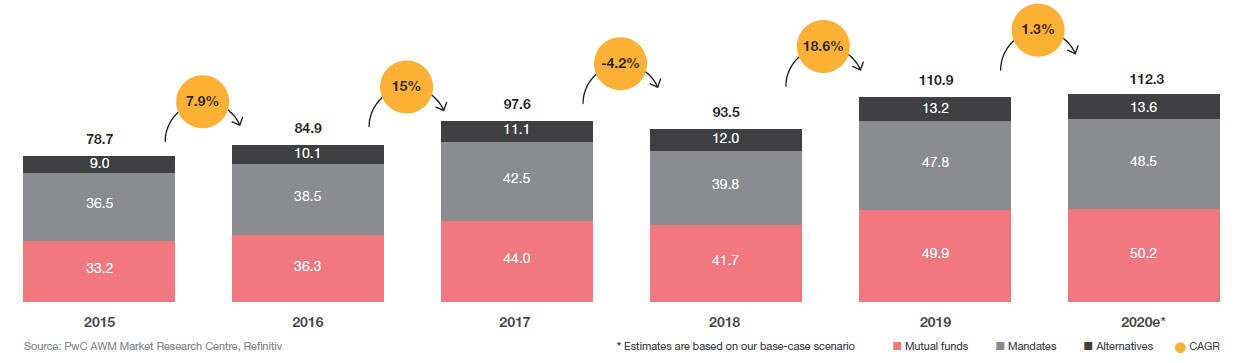
Up until end-2019 global assets grew faster than we expected. Our forecast model in 2014 predicted that by 2020 the AM industry would manage USD 101.7tn of clients’ assets. In our update in 2017 we increased our estimations for the industry to reach USD 111.2tn AuM by 2020.
In reality, asset growth grew at a slightly faster clip, posting a 9.0% CAGR from 2015 to reach USD 110.9tn as of end-2019. As expected, this rise in assets was particularly bolstered by pension funds HNWIs and sovereign wealth funds increasing allocations to alternative investments. That being said, there was also an uptake within the retail segment, with an influx of millennials and Gen Z working adults looking to create long term wealth, as well as baby boomers looking to accumulate wealth from retirement funds.
Figure 1: Global AuM 2015-2020e (USD tn)
Outcomes matter
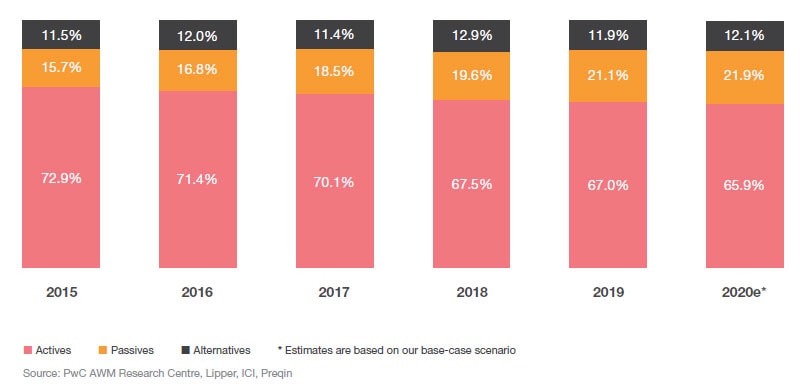
We projected that increasing investor interest in passive and alternative strategies would see these investments constitute 35% of total industry assets by 2020.
Our projections have materialised. As of the end of 2019, assets in alternatives had risen by a CAGR of 10.1% to USD 13.2tn from 2015, and passives had grown by a CAGR of 17.4% to USD 23.4tn; together making up 33% of total industry assets. As expected, this growth in alternatives was driven by a low interest environment and institutional demand for alpha. Demand for lower fees and stronger performance has also promoted a shift towards passives as predicted.
Figure 2: Percentage allocation of actives, passives, and alternatives
Buyers’ market (fee models are transformed)
We predicted that the combination of rising regulatory pressure, the rise of passives and investor scrutiny would cause fee levels and models to be challenged.
In recent years we have seen mounting regulatory pressure that has fostered transparency and fee innovation in the AWM space.This pressure comes not only from regulators, however. Institutional investors are growing critical of active managers demanding high fees without providing alpha. In response, we have seen managers revamping their fee structures; cutting fees or embracing new innovative fee models in order to increase the attractiveness of their products to investors.
Technology: do or die
We predicted that, by 2020, technology would become mission critical to driving customer engagement, gathering and synthesising data, operational efficiency, and regulatory and tax reporting.
As predicted, technology has evolved to become one of the key focus areas of the asset management industry, with all leading industry participants attributing unprecedented attention to the importance of digitalisation and the opportunities that it presents.As a result, leading managers in 2020 are embracing digitalisation in order to thrive in the face of rising competition and disruption – and the increasingly digital world we find ourselves in as a result.
Distribution is redrawn
AWM 2020 predicted that, by 2020, four distinct regional fund distribution blocks (North Asia, South Asia, Latin America and Europe) would have formed, marking a move towards overcoming the fragmented nature of the regional fund industry and allowing for products to be sold pan-regionally.
While we have seen this materialise to a certain extent, the development of passporting and inter-regional distribution blocks has been slower than expected. While we do believe that these efforts will progress in the future, development will likely be slow - given the varied interests of each of the countries and regions and the lack of an economic or political union comparable to the EU. Further, the decline of globalisation amid rising nationalism and inter-regional disputes could further complicate regional distribution.
Funding the future
Going into 2020, AWMs were expected to partially fill the lending gap stemming from banks cutting their financing to the real economy as a result of rising regulatory limitations imposed following the global financial crisis (GFC). This was particularly pronounced in terms of small and medium enterprise (SME) financing and infrastructure projects. We also expected the AWM industry to increase its footprint in providing solutions for retirement.
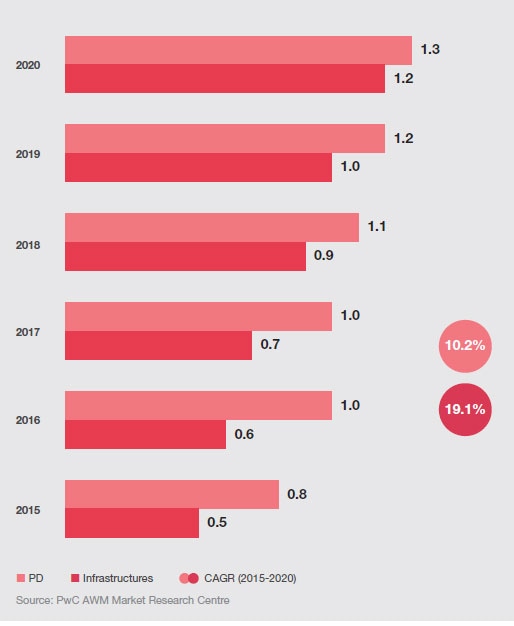
As expected, infrastructure and private debt (PD) assets have undergone a formidable growth since the release of ‘a Brave New World’ in 2014, growing at a respective 18.9% and 10.7% CAGR from 2015 to 2019; with infrastructure assets doubling in that period.We have also seen an increasing number of managers seeking new opportunities in private debt and infrastructure. This growth is pushed by both supply and demand-side factors.
Figure 3: Global Infrastructure and PD assets (USD tn)
A New breed of global asset managers
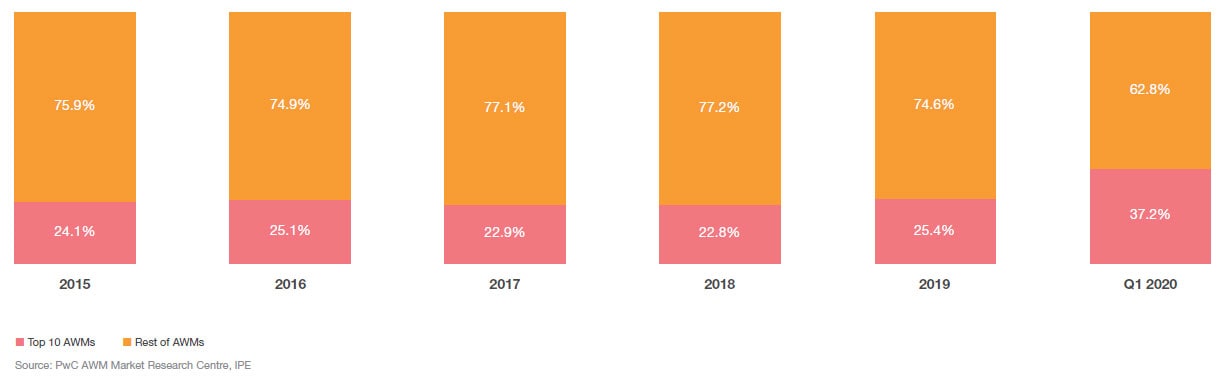
"AWM 2020" predicted that 2020 would see the emergence of a new breed of mega-managers with footprints in both developed and emerging markets. We expected that these managers would have highly streamlined platforms, targeted solutions for customers and stronger and more trusted brands.
Our predictions have partially materialised. We have seen the large industry players holding an even higher concentration of assets – particularly those providing low cost products, strong brand recognition, and digitally enhanced services leading the pack. However, we have not seen an emergence of new mega players within the traditional or alternative asset management industry, with only the major incumbent managers undergoing a notable increase in scale.
Figure 4: Asset concentration within top 10 AWMs (%)
AWM: From 'A brave new world' to a new normal
Contact us
Olwyn Alexander
Global Asset & Wealth Management Leader, Partner
PwC Ireland
olwyn.m.alexander@pwc.com
+353 0 1 792 8719
Steven Libby
EMEA Asset and Wealth Management Leader, Partner
PwC Luxembourg
steven.libby@pwc.com
+352 49 48 48 2116
Elizabeth Stone
UK Asset and Wealth Management Leader, Partner
PwC UK
elizabeth.stone@pwc.com
+44 0 207 804 9678
Peter Finnerty
Global Asset and Wealth Management Assurance Leader, Partner
PwC US
peter.finnerty@pwc.com
+1 617 530 4566
Andrew O’Callaghan
Global Asset and Wealth Management Advisory Leader, Partner
PwC Ireland
andy.ocallaghan@pwc.com
+353 1 792 6247
Bernadette Geis
US Asset and Wealth Management Leader
bernadette.m.geis@pwc.com
+1 617 955 1997
Justin Ong
Asia Pacific Asset and Wealth Management
Leader, Partner
PwC Singapore
justin.ong@sg.pwc.com
+65 6236 3708
Dariush Yazdani
Asset and Wealth Management Global Market Research Centre Leader, Partner
PwC Luxembourg
dariush.yazdani@pwc.com
+352 49 49 48 2191
Marie-Anne Kong
Hong Kong Asset and Wealth Management Leader, Partner
PwC Hong Kong
marie-anne.kong@hk.pwc.com
+852 2289 2707
We would like to thank John Siciliano, Senior Advisor to PwC US, for his contributions to this report.


